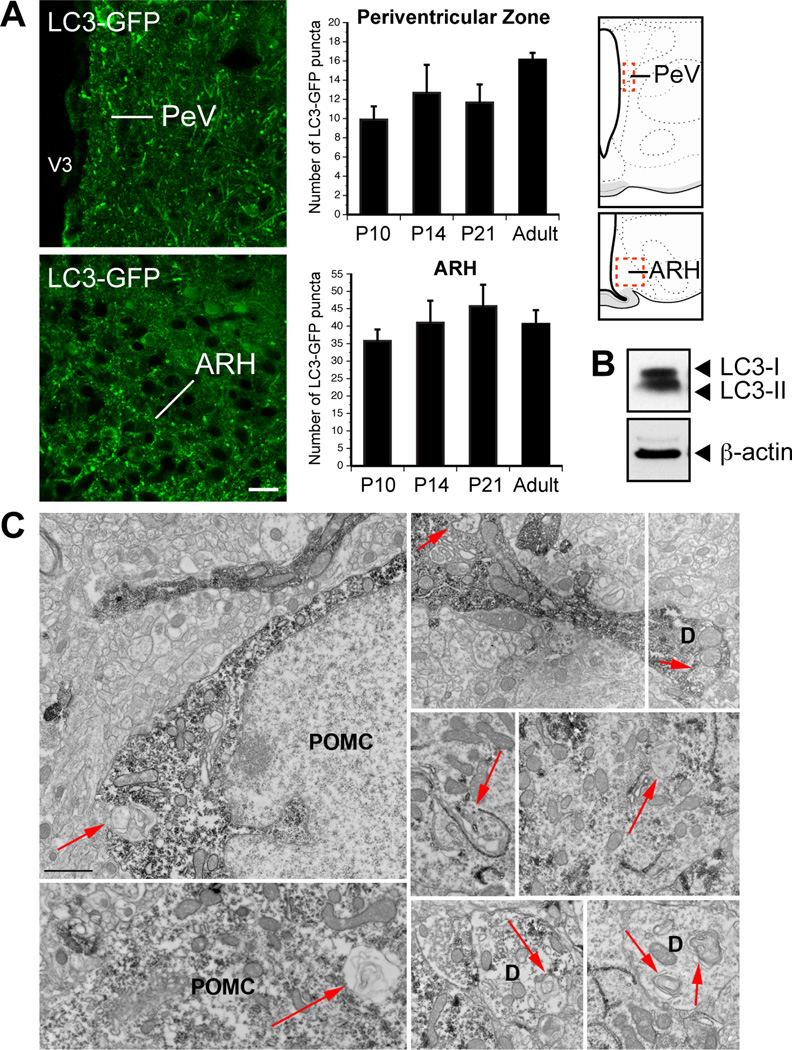
Figure 1.
Identification of autophagy in hypothalamic POMC processes. (A) Representative images and quantification of LC3-GFP puncta in the arcuate nucleus (ARH) and the hypothalamic periventricular zone (PeV) of P10, P14, P21, and adult (8- to 9-week-old) mice (n = 4–5 per group). Dashed boxes in the schematics represent the approximate borders of the areas used for quantification. (B) Immunoblot analysis of LC3 (LC3-I, 18 kDa; LC3-II, 16 kDa) and b-actin (as a loading control) from hypothalami derived from adult mice. (C) Representative electron micrographs showing autophagosomes (arrows) in POMC-immunolabeled perikarya and processes of P24 wild-type mice. D, dendrites, V3, third ventricle. Values are shown as mean ± SEM. *P < 0.05 versus Atg7loxP/loxP. Scale bar, 15 um (A) and 1 um (C).

