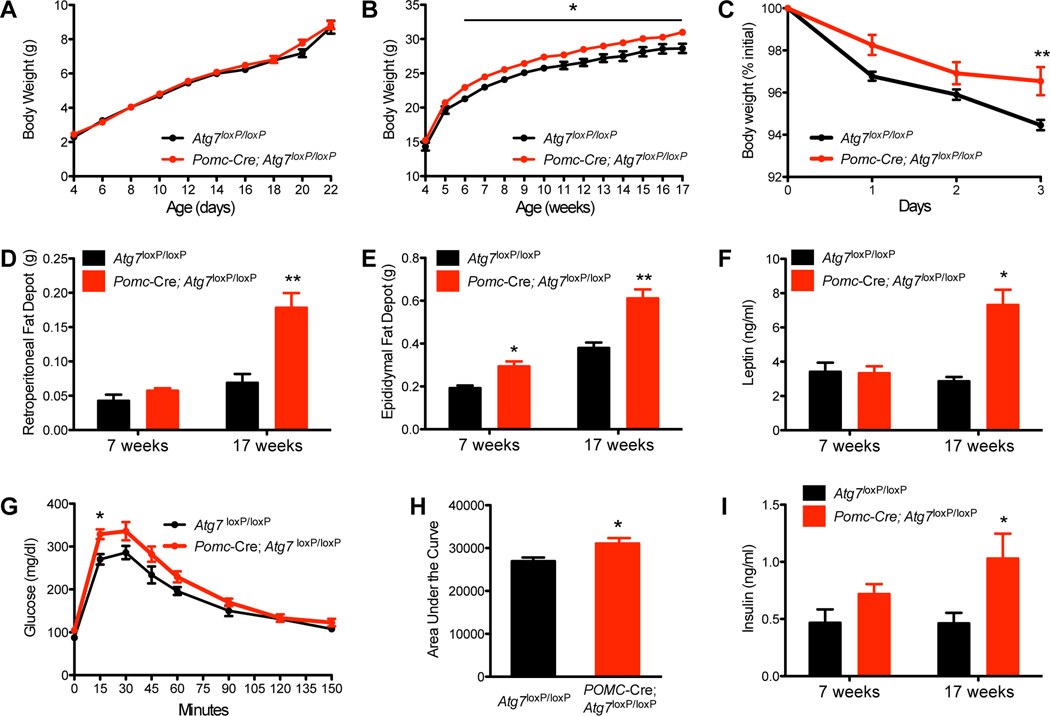
Figure 2.
Altered metabolism in mice lacking autophagy in POMC neurons. (A) Pre- and (B) post-weaning growth curves of Atg7loxP/loxP (n ≥ 9) and Pomc-Cre; Atg7loxP/loxP (n = 15) male mice. (C) Leptin sensitivity of 10-week-old Atg7loxP/loxP (n = 6) and Pomc-Cre; Atg7loxP/loxP (n = 8) male mice. Mass of (D) retroperitoneal and (E) epididymal fat of 7- and 15- to 17-week-old Atg7loxP/loxP (n = 4–5) and Pomc-Cre; Atg7loxP/loxP (n = 5–11) male mice. (F) Serum leptin and (I) insulin levels in Atg7loxP/loxP (n = 8) and Pomc-Cre; Atg7loxP/loxP (n = 6) male mice from 7- and 15–17 weeks of age. (G) Glucose tolerance test (GTT) and (H) area under the GTT curve of 8- to 9-week-old Atg7loxP/loxP (n = 7) and Pomc-Cre; Atg7loxP/loxP (n = 12) male mice. Values are shown as mean ± SEM. *P < 0.05 versus Atg7loxP/loxP.

