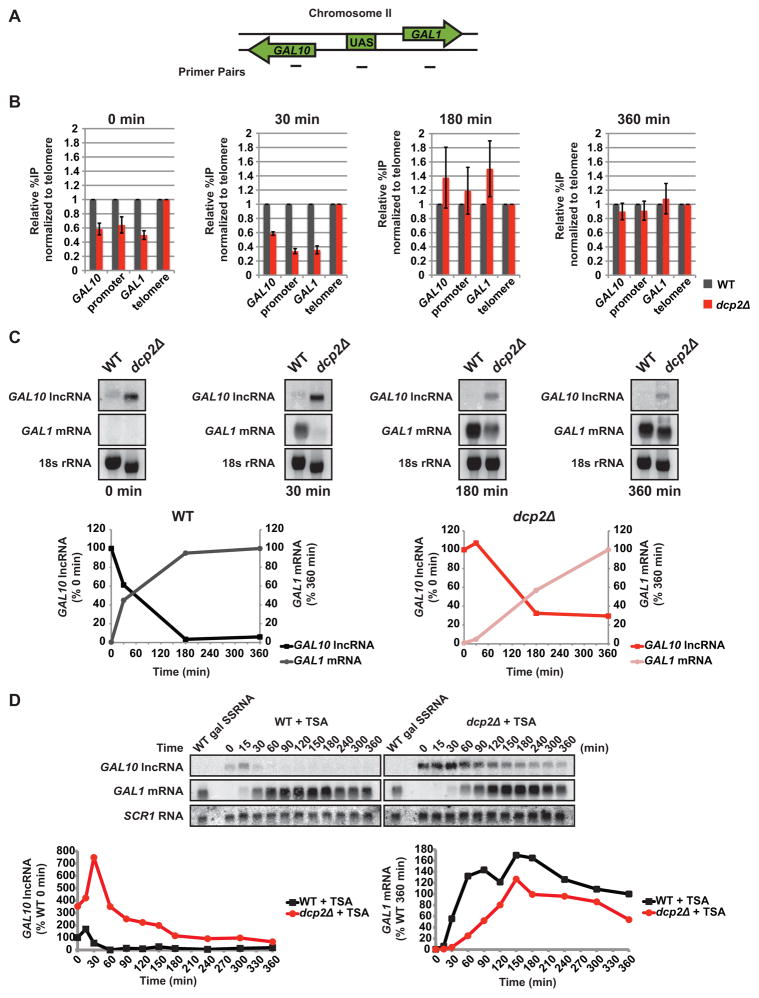
Figure 5. Decapping influences chromatin at the GAL10-GAL1 locus.
(A) Diagram of ChIP primer set positions at the GAL10-GAL1 locus. (B) Cells were grown as in Fig 4B and aliquots were crosslinked at 0, 30, 180, and 360 minutes of galactose exposure. Co-immunoprecipitated DNA from ChIP against acetylated H3K18 was amplified by qPCR. Acetylation relative to WT is displayed as a percentage of input normalized to a telomeric location. (C) Cells were grown as in Fig 4B and RNA was analyzed by Northern probing for GAL10 lncRNA and GAL1 mRNA with 18S RNA ethidium stain as the loading control. RNA levels for WT and dcp2Δ were plotted with GAL10 lncRNA levels represented as a percentage of the 0 min and GAL1 mRNA levels as a percentage of the 360 min time points. (D) GAL1 mRNA expression was induced by galactose in cells grown in raffinose and 10 μM trichostatin A (TSA). GAL10 lncRNA decay and GAL1 mRNA accumulation was measured by Northern with SCR1 RNA as the loading control. GAL10 lncRNA levels are represented as a percentage of WT 0 min and GAL1 mRNA levels as a percentage of WT 360 min time points.

