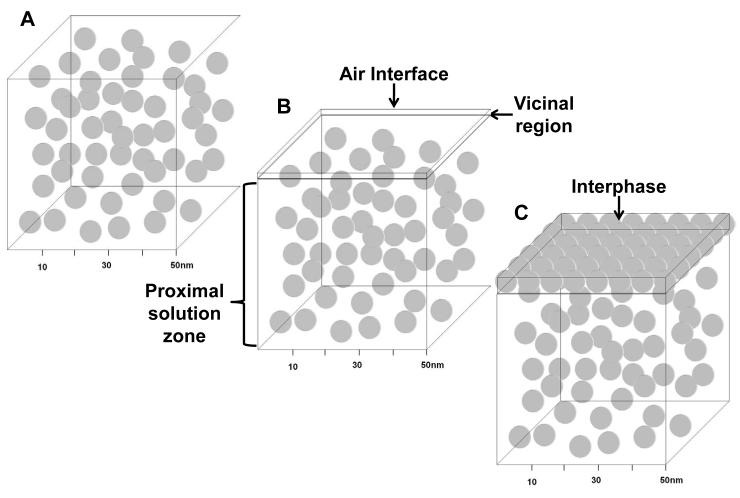
Figure 6.
Sequence of events leading to the adsorption of human serum albumin (HSA, gray spheres) to a liquid-air surface that interprets neutron reflectometry (NR) data (Section 4.8.2). Panel A is derived from Fig. 4 by removing all other proteins from the hypothetical 50X50X50 nm cube of blood plasma. Panel B represents the instant of creating an air interface on top of Panel A but before any movement of HSA occurs. Panel C releases the stop-motion constraint allowing HSA molecules to diffuse into an inflating interphase, ultimately achieving the interphase concentration detected by NR. Calculations suggest that a packed hexagonal array of molecules is required to achieve NR concentration, as depicted in Panel C.

