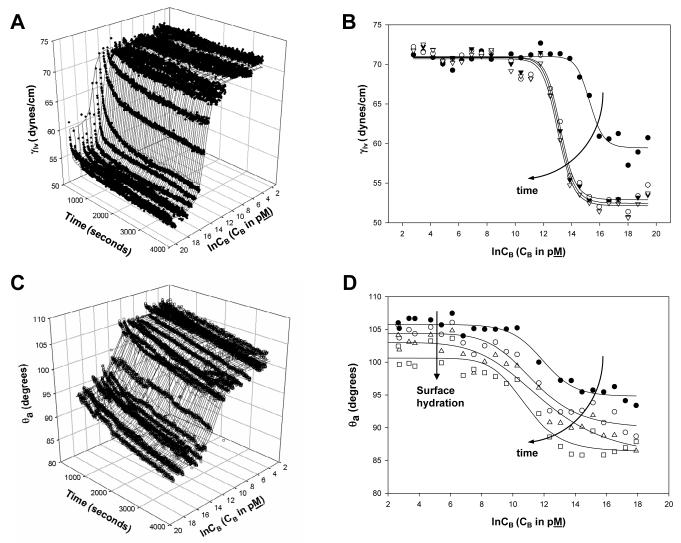
Figure 8.
Time-and-concentration interfacial tensions γlv (Panel A,B) and advancing contact angles θa (Panel C,D) for human serum albumin (fatty-acid free HSA) and prothrombin (blood factor FII), respectively. Panels A,B plot γlv as a function of logarithmic (natural) solution concentration CB scaled as picomoles/L [20]. Panels C,D plot θa of FII solutions on a methyl-terminated SAM surface [23]. Panels A,C display results in 3D coordinates plotting γlv or θa as a function of concentration and analysis time (drop age). Panels B,D show only selected time slices taken from Panels A,C (Panel B: filled circle = 0.25 sec, open circle = 900 sec, filled triangles = 1800 sec, open triangles = 3594 sec. Panel D: filled circle = 0.25 sec, open circle = 900 sec, open triangles = 1800 sec, and open squares = 3594 sec). Notice that kinetics dominates early protein adsorption, requiring 30 min to 1 hr to reach steady state and that surface hydration (Panel D) slowly increases SAM surface wettability (vertical arrow annotation, Panel D).

