
Figure 4.
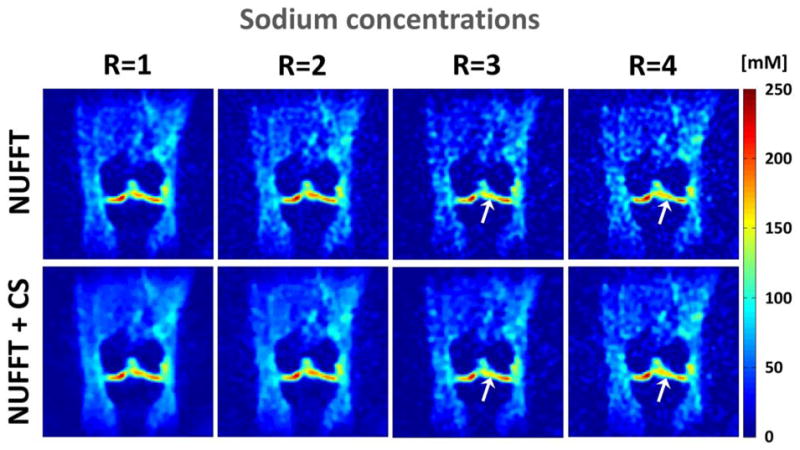
Tissue Sodium Concentrations (TSC) in mM corresponding to the images shown in Fig. 3 obtained with NUFFT without CS and with CS, with the parameters λ1=0.0005, λ2=0.0005, for acceleration factors R=1, 2, 3 and 4. The white arrows indicate zones in the femorotibial lateral cartilage where a loss of sodium concentration seems to appear in the data with R=3 and 4 (with and without CS), and which could be misinterpreted as a loss of GAG in cartilage.