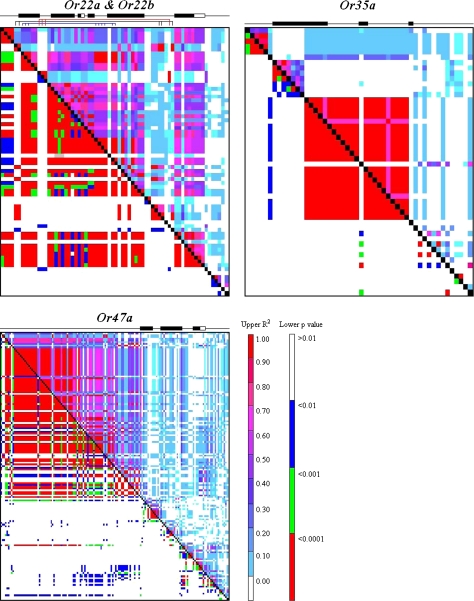
Figure 4.
LD plots between markers for each odorant receptor. The upper diagonal represents the R2 value, whereas the lower diagonal represents the P value for all marker combinations. R2 values of 1 indicate complete LD. The location of coding and noncoding regions for each gene is shown above each LD plot with coding regions indicted by black boxes and untranslated regions by white boxes. In the case of the Or22a/Or22b gene region, colored lines below the gene region highlight distinct regions of long-range LD.

