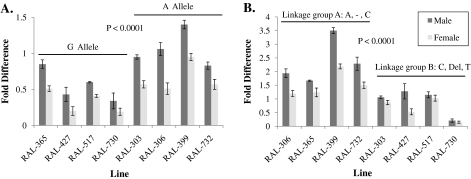
Figure 7.
Or35a and Or47a gene expression levels. For each gene, lines with overall more negative behavioral response indices to ethyl hexanoate and carrying a given allele and lines with more positive response indices carrying the alternate allele were selected. (A) Or35a expression levels across lines carrying either the −455G allele or the −455A SNP. (B) Or47a expression levels for the linkage group comprised of A1336C, 1349 Del 2 bp, and C1357T that are in complete LD. A dash indicates a lack of deletion.

