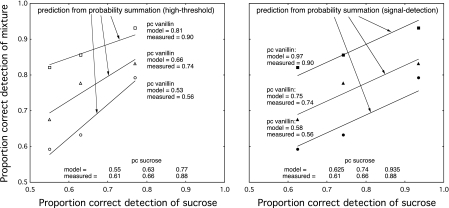
Figure 4.
Average proportions of correct detections of 9 flavor mixtures (sucrose and vanillin), pcM, compared with the predictions of 2 models of PS: high threshold (left panel) and signal detection (right panel). The straight lines represent best fits based on the 2 models, each of which requires estimating the proportions of correct detections of the individual flavorants, pcG (sucrose) and pcO (vanillin). These estimates differ in the 2 models. In each panel, the measures of pcM are plotted as a function of the estimated value of pcG, separately for each estimated value of pcO. Data are from Marks et al. (2007).

