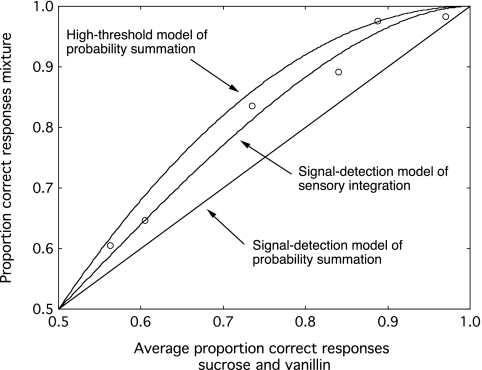
Figure 5.
Probability of correct detection of sucrose–vanillin mixtures (pcM), plotted against the average probability of correct detection of sucrose alone (pcG) and vanillin alone (pcO) in 2AFC. Data are from Ashkenazi and Marks (2004). The solid and small-dashed lines show the predictions of the high-threshold and signal-detection models of PS, respectively. For comparison, the large-dashed line shows the prediction of a signal-detection model of neural integration (Green and Swets 1966), which predicts that the detectability of the mixture, quantified by d′, will equal the square root of the sum of the squared values of d′ of the components.

