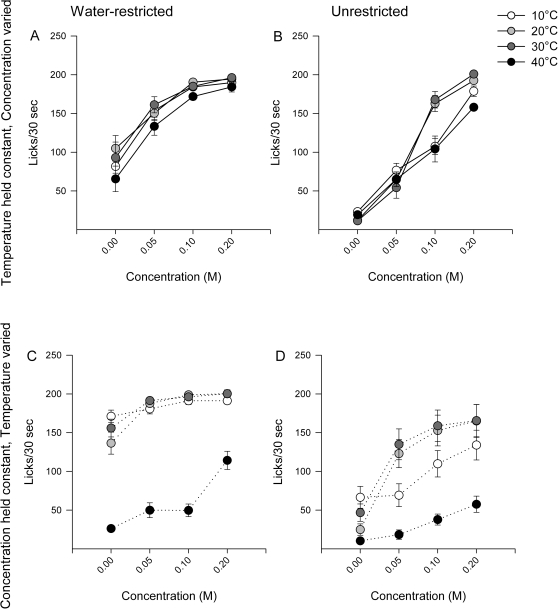
Figure 4.
Data represent mean ± standard error of the mean of licks/30 s. Panels A and B represent the trials in which the temperature was maintained constant and solution concentration varied within a session. Panels C and D represent the trials in which the test solution concentration was maintained constant and temperature varied within a session. Although the stimuli were presented with the concentration constant within a session, the data are graphed across concentration to allow for comparison with panel A.

