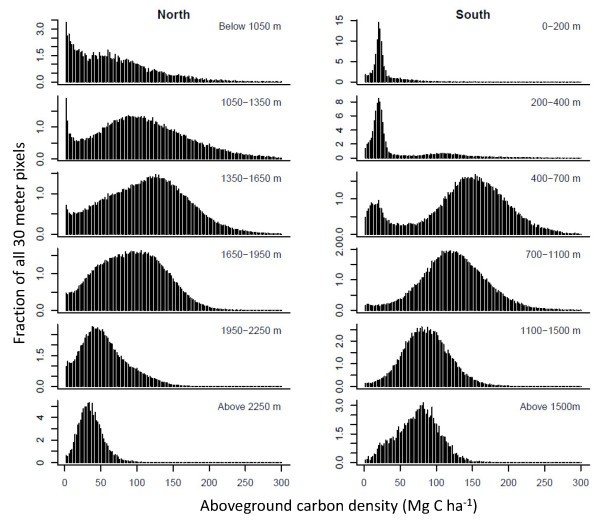
Figure 4.
LiDAR-derived frequency distributions of forest ACD at 30-m resolution by elevation class in the northern and southern regions of Madagascar. Bimodal distributions in the southern region reflect the contrast between spiny forest (nearly all of which are found < 500 m elevation) and humid forests (which are nearly absent at elevations < 500 m due to heavy deforestation and degradation). At high resolution, ACD can peak at very high values (> 300 Mg C ha-1), but we truncate here to facilitate visualization because these high-ACD outliers are much less than 0.1% of any class.

