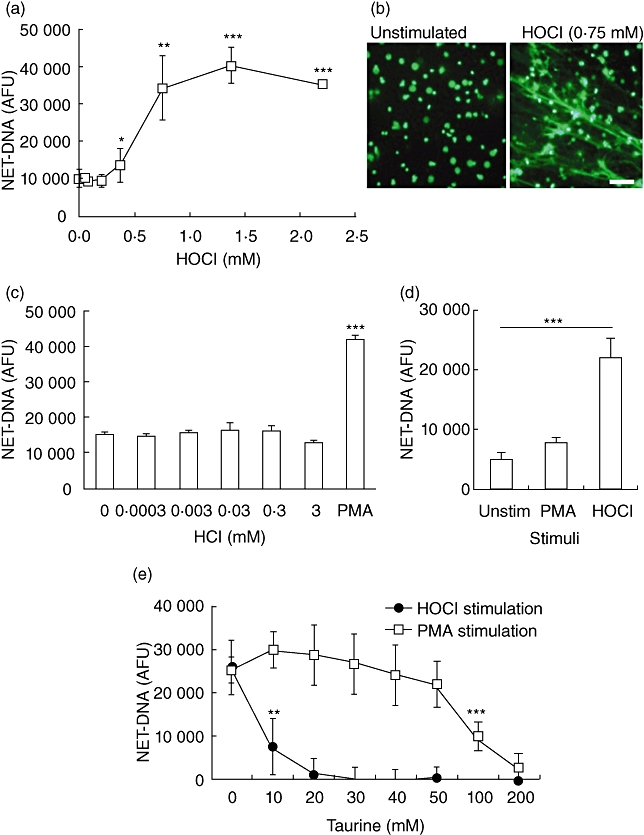
Fig. 4.

(a) Fluorometric quantification of neutrophil extracellular trap (NET)-DNA from hypochlorous acid (HOCl)-stimulated neutrophils after 3 h incubation. Data represent six independent experiments ± standard deviation (s.d.). (b) Images of SYTOX-stained NET-DNA released after 3 h in the absence or presence of HOCl 0·75 mM. Bar represents 50 µm. (c) Fluorometric quantification of NET-DNA from hydrochloric acid (HCl) stimulated neutrophils after 3 h incubation. Experiment performed in quadruplicate ± s.d.; phorbol myristate acetate (PMA) 25 nM stimulation included as positive control. (d) Fluorometric quantification of NET-DNA released from chronic granulomatous disease (CGD) neutrophils after 3 h incubation with HOCl 0·75 mM. Data representative of three independent experiments ± s.d. *P ≤ 0·05, **P ≤ 0·01, ***P ≤ 0·001 by two-tailed paired t-test in comparison to unstimulated cells. (e) Fluorometric quantification of NET-DNA from PMA 25 nM or HOCl 0·75 mM-stimulated neutrophils after 3 h incubation in the absence or presence of taurine. Data represent four independent experiments ± s.d. **P ≤ 0·01, ***P ≤ 0·01 by two-tailed paired t-test in comparison to 0 mM taurine.
