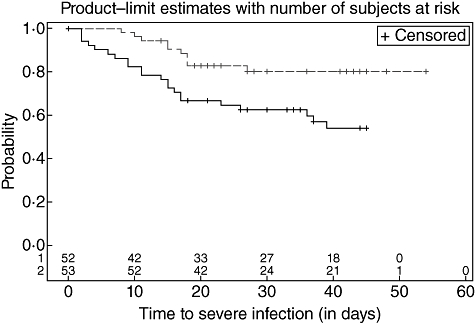
Fig. 1.

Time to severe infection stratified by M-ficolin levels. The 105 patients were divided into two groups according to the levels before chemotherapy as described in the result section: solid line: patients with M-ficolin below 360 ng/ml serum and dashed line: patients with more than 360 ng/ml.
