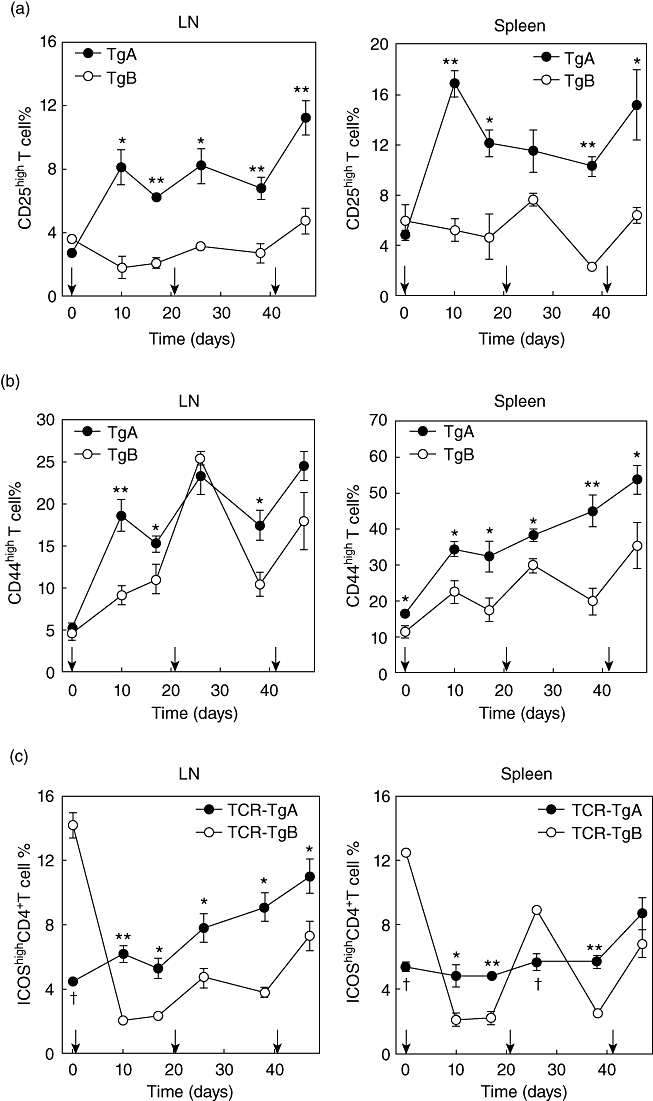
Fig. 2.

Characterization of T cell activation markers and co-stimulatory molecules by flow cytometry. Changes in the percentage of activated CD4+ T cells during rhG1 immunization of proteoglycan T cell receptor transgenic (PG-TCR-Tg) mice. Diagrams show the percentages of CD25highCD4+ T cells (a) and CD44highCD4+ T cells (b) in the peripheral lymph nodes (LN) and spleens of TCR-TgA and TCR-TgB mice. Changes in the proportions of inducible T cell co-stimulator (ICOS)highCD4+ T cells during immunization (c). The line graphs show the percentages of ICOShighCD4+ T cells in peripheral LNs and spleens of TCR-TgA and TCR-TgB mice. In all diagrams the mean ± standard error of the mean values at each time-point were obtained from four animals. Vertical arrows on the x-axes depict time-points of rhG1 immunizations. Significantly higher (*P ≤ 0·05; **P ≤ 0·01) or lower (†P ≤ 0·05) values (TCR-TgA versus TCR-TgB) are indicated.
