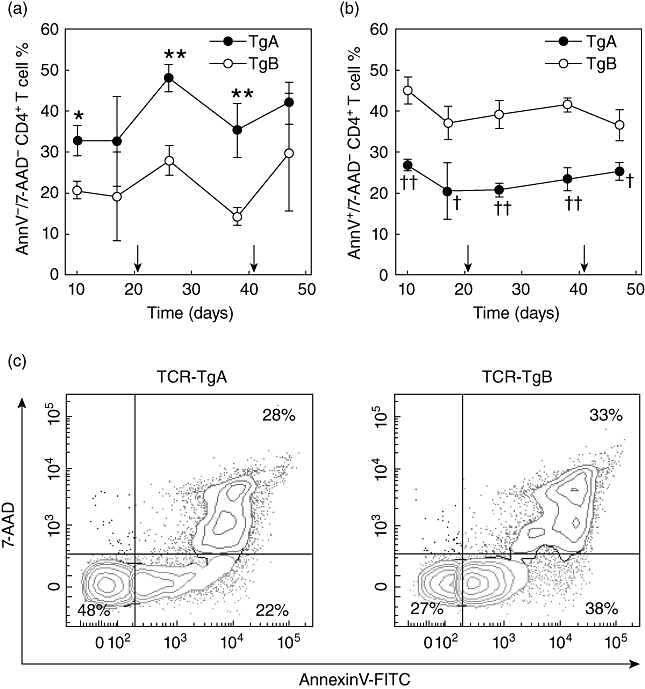
Fig. 3.

Comparison of in vitro apoptosis (activation-induced cell death) of T cells isolated from the spleens of TCR-TgA and TCR-TgB mice. Purified T cells were cultured with irradiated A20 cells pretreated with 5/4E8 synthetic peptide for 72 h. Apoptosis was assessed by annexin V/7-amino-actinomycin (7-AAD) staining using flow cytometry. Diagrams show (a) the percentages of viable (annexin V-/7-AAD–) and (b) early apoptotic (annexin V+/7-AAD–) CD4+ T cells. Arrows on the x-axis indicate the second and third rhG1 immunizations. Significantly higher *P < 0·05; **P < 0·01 or lower †P < 0·05; ††P < 0·01 values (TCR-TgA versus TCR-TgB) are indicated (n = 3 animals at each time-point). (c) Representative flow cytometric contour plots show annexin V/7-AAD staining of in vitro-stimulated T cells of TCR-TgA and TCR-TgB mice. The percentages of viable (annexin V-/7-AAD–, lower left quadrant, green), early apoptotic (annexin V+/7-AAD–, lower right quadrant, orange) and late apoptotic (annexin V+/7-AAD+, upper right quadrant, red) cells are indicated. Samples were collected 10 days after the second immunization.
