
Figure 3.
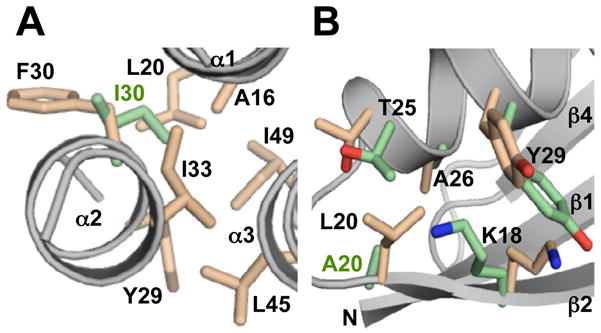
Structural changes in going from 95% to 98% sequence identity. (A) GA95 to GA98. A representative structure from the NMR ensemble for GA98, highlighting some of the hydrophobic core residues (pale orange) and the position of F30 relative to the core. By comparison, the position of I30 in GA95 is also shown (green). The main chain is in gray. (B) GB95 to GB98. A representative NMR structure of GB98 highlighting the A20L mutation site region in going from GB95 to GB98. GB98 side chain positions (pale orange) are compared with the corresponding GB95 conformations (green).