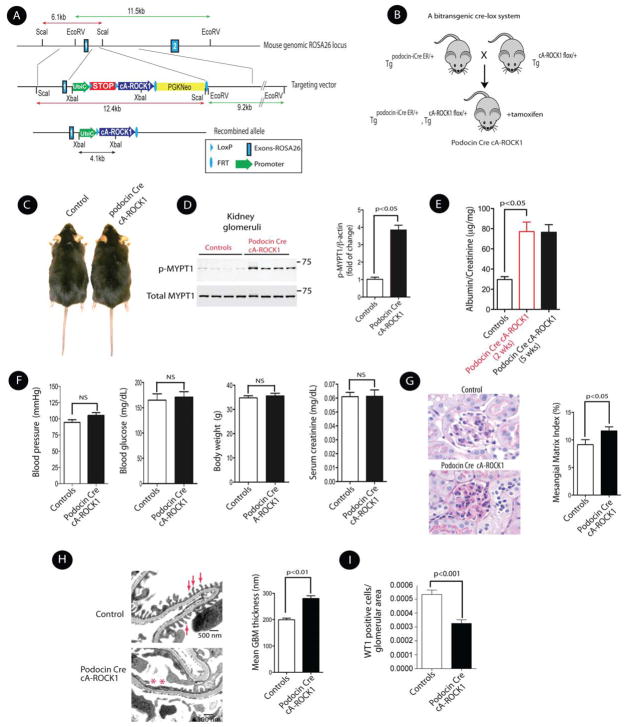
Figure 3. Generation and Initial Characterization of Inducible Podocin Cre cA-ROCK1 Knock-In Mice.
(A) The schematic diagram illustrates the ROSA26 targeting locus, cA-ROCK1 targeting construct, and the conditional allele after homologous recombination. The ubiquitin C promoter (UbiC; green arrow) was used to drive constitutively active ROCK1 cDNA (cA-ROCK1; blue arrow) expression. (B) Breeding scheme of bitransgenic podocin Cre cA-ROCK1 mice. (C) Gross appearances of control and inducible podocin Cre cA-ROCK1 knock-in mice. (D) ROCK1 activity in the kidney glomeruli was performed by assessing p-MYPT in podocin Cre cA-ROCK1 knock-in mice (left panel). Quantitation of phospho-myosin phosphatase target subunit 1 (p-MYPT1) in each group (right panel). (E) Albumin/creatinine ratio in podocin Cre cA-ROCK1 knock-in mice at 2 and 5 weeks post tamoxifen injection. (F) Systolic blood pressure, blood glucose, body weights and serum creatinine were assessed in podocin Cre cA-ROCK1 mice. (G) Photomicrographs of PAS staining from glomeruli of podocin Cre cA-ROCK1 (original magnification, x400) (left panel), and quantification of Mesangial Matrix Index in each group (right panel). (H) Representative electron micrographs of kidneys (left panel), and quantification of mean GBM in each group (right panel). Foot processes are indicated by arrows, and effacement of these processes are indicated by asterisks. I) Podocyte numbers were quantified in each group as previously described. All data are presented as means ± SEM (n=4–10/each group), and analyzed by one-way ANOVA.

