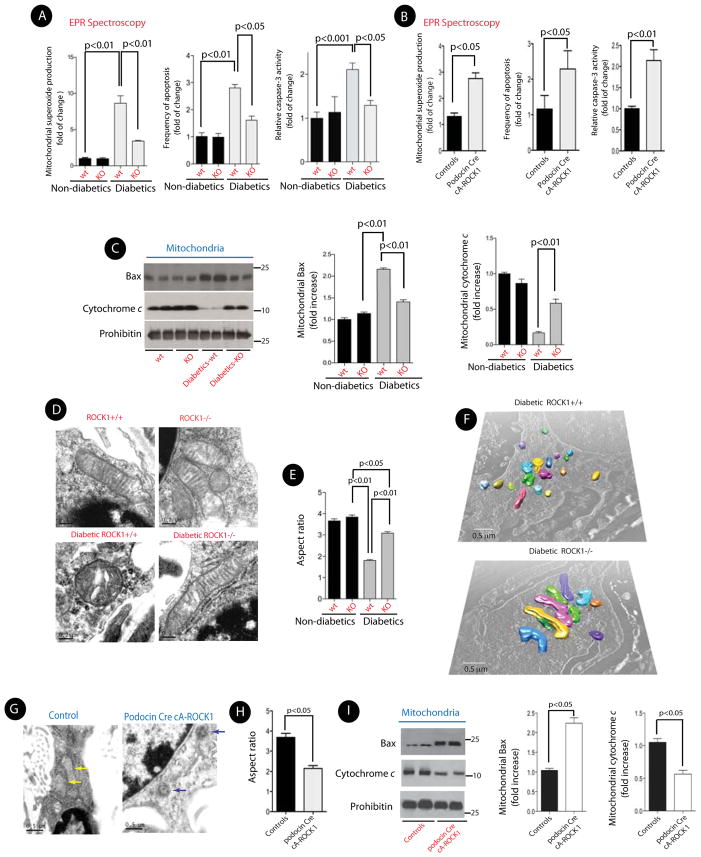
Figure 4. Deletion of ROCK1 Prevents Mitochondrial Fission, mtROS, and Glomerular Apoptosis.
(A) Quantitative measurement of superoxide generation in isolated mitochondria from kidney glomeruli by EPR spectroscopy (left panel). Bar graph summarizing the number of apoptotic cells in glomeruli per 50 glomeruli counted in each group (middle panel). Bar graph summarizing caspase-3 activity in kidney glomeruli in different groups (right panel). (B) Quantitative measurement of superoxide generation (left panel), frequency of apoptosis (middle panel), and caspase-3 activity in isolated mitochondria from kidney glomeruli from podocin Cre cA-ROCK1 mice by EPR spectroscopy. (C) Representative Western blots (left panel) and bar graphs of Bax (middle panel) and cytochrome c (right panel)) of mitochondrial fractions obtained from kidney glomeruli in each group. All data are presented as means ± SEM (n=8–12/each group), and analyzed by one-way ANOVA. (D) Representative 2D-EM micrographs of mitochondria in podocytes from each group. (E) Quantification of mitochondrial Aspect ratio in podocytes. A total of 150 mitochondria in each group from 4 different animals were evaluated. (F) Representative 3D-EM images of mitochondria in podocytes from STZ-induced diabetic ROCK+/+ and diabetic ROCK−/− mice. (G) Representative micrographs of mitochondrial morphology in podocytes from a control and a podocin Cre cA-ROCK1 knock-in mouse. (H) Quantification of mitochondrial Aspect ratio from 4G. (I) Representative Western blots of mitochondrial Bax (mtBax) and cytochrome c (left panel) obtained from kidney glomeruli in each group. Quantification of mtBax (middle panel) and cytochrome c (right panel) from three independent experiments. All data are presented as means ± SEM (n=4–10/each group), unless stated otherwise, and analyzed by one-way ANOVA.

