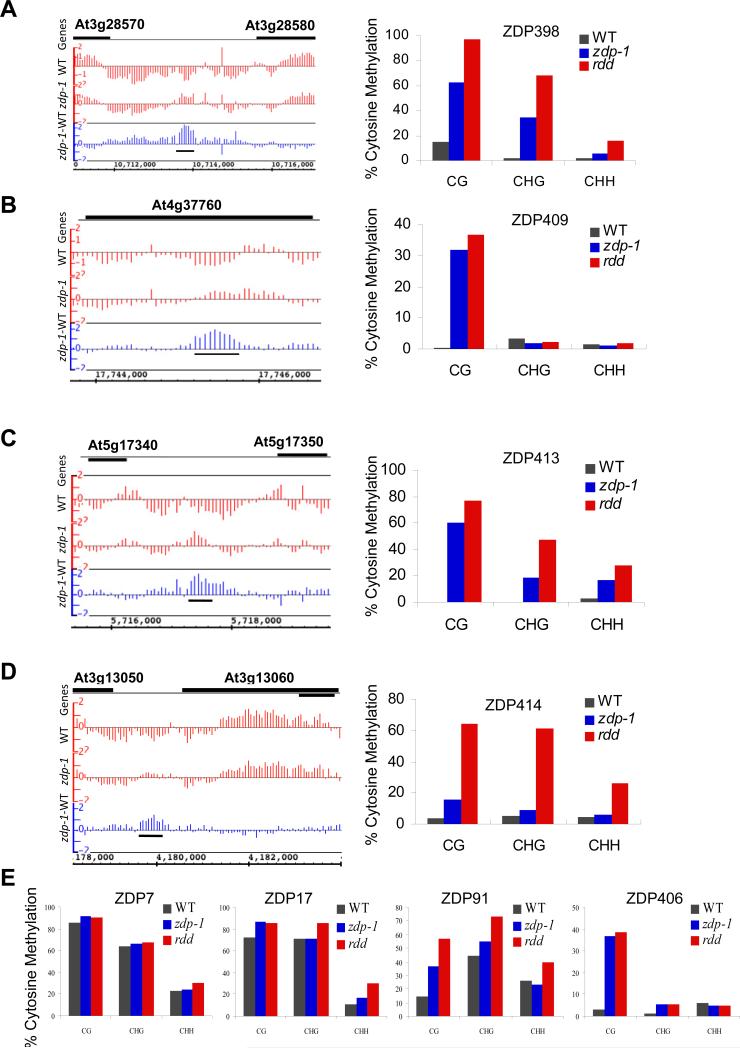
Figure 4. Confirmation of randomly chosen hypermethylated regions by bisulfite sequencing.
(A-D) For each region, the left panel shows the context of the hypermethylated region (indicated by a black horizontal bar under the blue bars) and tiling array signals. The right panel shows the bisulfite sequencing results for the corresponding locus in wild type and zdp-1, as well as the rdd mutant plants. (E) Bisulfite sequencing results for four other loci which show hypermethylation in the tiling array data in zdp-1 mutant plants. See Figure S4 for the whole genome methylation profile in wild-type and zdp-1 mutant plants and Figure S5 for more loci DNA methylation level. Also see Table S2 for the primers used in bisulfite sequencing, Table S3 for hypermethylated loci in zdp-1 mutant plants, Table S4 for hypomethylated loci in zdp-1 mutant plants, and Table S5 for detailed percent methylation of loci in different plants.

