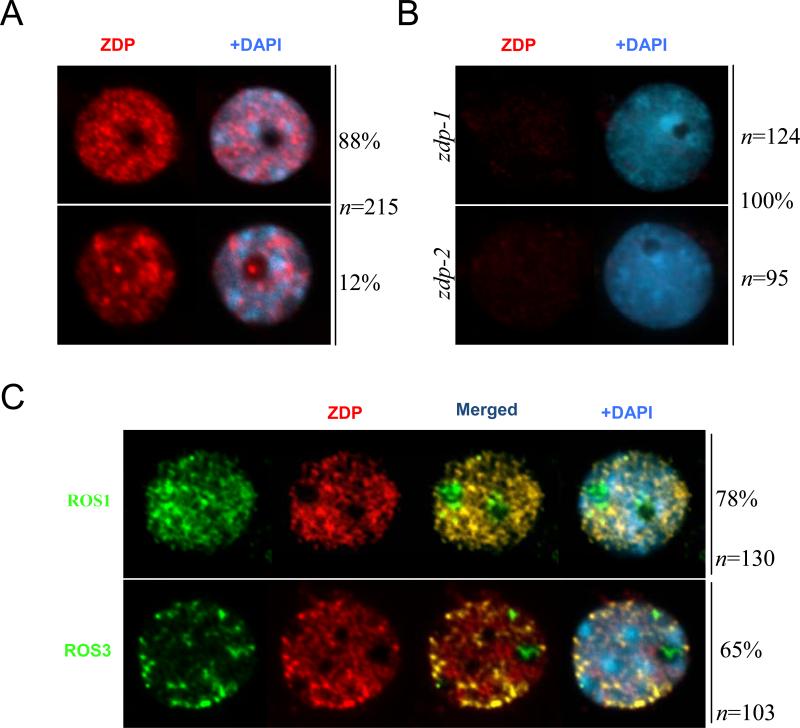
Figure 6. Sub-nuclear localization of ZDP and co-localization with ROS1 and ROS3.
(A and B) The nuclear distribution of ZDP was analyzed by immunostaining using anti-ZDP (red) in wild type (A) and zdp mutants (B). (C) Dual immunolocalization using anti-ZDP (red) in transgenic lines expressing recombinant full-length epitope-tagged MYC-ROS1 and Flag-ROS3 (green). In all panels the DNA was stained with DAPI (blue). The frequency of nuclei displaying each interphase pattern is shown on the right.

