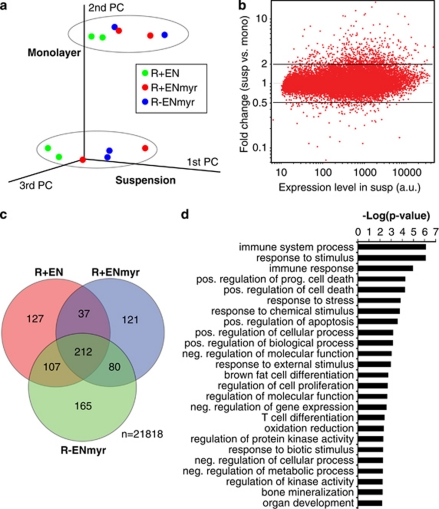
Figure 1.
Cellular detachment induces a multi-faceted transcriptional pattern resembling diverse bioenergetic stress responses. (a) Principal-component analysis illustrating the three largest sources of variation in GEPs, showing clustering of samples based primarily on culture conditions (suspension versus monolayer). (b) Scatter-plot summarizing the mean fold changes of individual genes in suspension as compared with monolayer culture (y-axis) as a function of the mean expression of each gene in all suspension culture samples (x-axis). (c) Venn diagram depicting the overlap of upregulated gene probesets in suspension for the indicated EN-transformed cell lines used in the microarray analysis. (d) GO biological process categories overrepresented in the 170 genes upregulated after detachment in all three EN-transformed cell lines (Supplementary Table S1), for all categories with FDR<0.10. The x-axis represents the negative log of the DAVID significance score P-values

