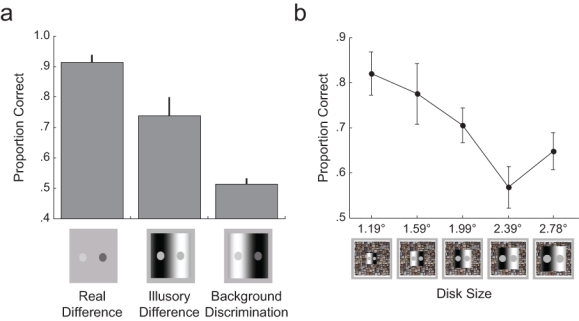
Fig. 2.

Mean proportion of correct responses in (a) Experiment 1 and (b) Experiment 2. In Task 2 of Experiment 1, participants judged which disk appeared brighter. In the real-difference condition, the two disks differed in physical brightness. In the illusory-difference condition, the two disks were the same physical brightness, and responses were judged correct if participants reported that the disk on the dark side of the stimulus was brighter than the disk on the light side. In Task 3, participants judged which side of the background was darker. The icons below the graph depict the stimuli presented to the suppressed eye. The graph in (b) shows the proportion of trials in Experiment 2 in which participants experienced simultaneous brightness contrast (i.e., they perceived the disk on the dark background as brighter than the disk on the light background) as a function of disk size. The icons below the graph depict the stimuli presented to the suppressed eye. The holes through which the gray circles appeared in the masking stimulus (not pictured) remained a constant size (smaller than the smallest disk). Error bars indicate 1 SEM.
