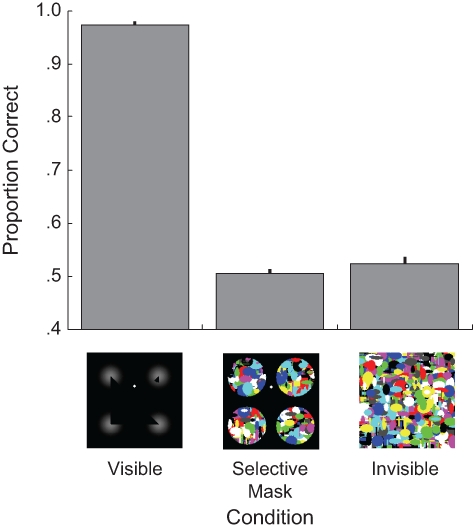
Fig. 3.

Mean proportion of correct responses in Experiment 3 as a function of condition. The three conditions, which are illustrated by the icons below the graph, all involved a Kanizsa triangle stimulus. In the visible condition, the stimulus was not masked. In the selective-mask and invisible conditions, a continuous flash suppression mask was presented in two different ways. Error bars indicate 1 SEM.
