
Fig. 1.
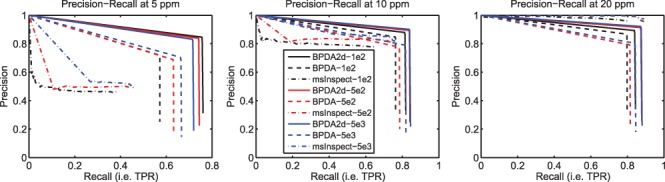
PR results for synthetic LC–MS datasets with different abundance levels (SNRs). Each panel shows the results obtained at a different mass window size as suggested by the title. Color codes for different abundance levels. Each method is represented by a unique line type. BPDA2d renders the best precision and sensitivity (i.e. recall) among all the methods compared for all abundance level in the first two mass window cases. In the last case, the performance between BPDA2D and msInspect has a very small difference.