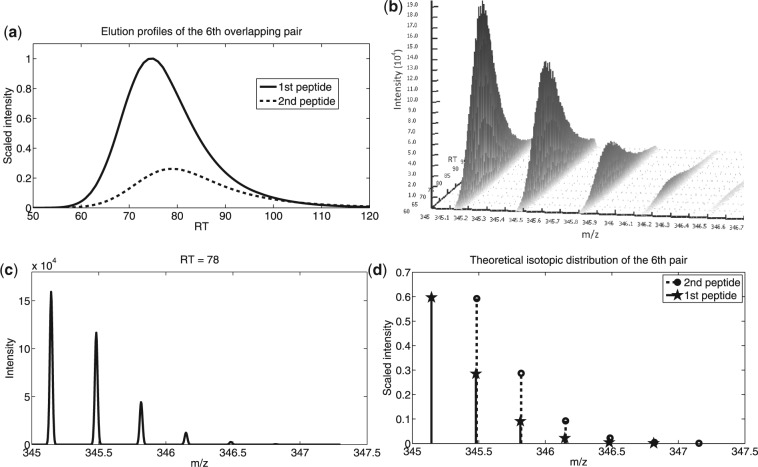
Fig. 3.
Overlapping signals of the sixth pair in 16-mix. (a) Overlapping LC profiles. (b) Signal peaks of the two peptides at charge state 3 in a 3D view. This region has a high SNR, where peaks of the second peptide almost get completely shadowed by all but the first isotope peak of the first peptide. (c) MS scan sampled at 78s showing signals of the same pair. The observed overall signal pattern deviates from (d) theoretic isotope patterns of the two peptides.

