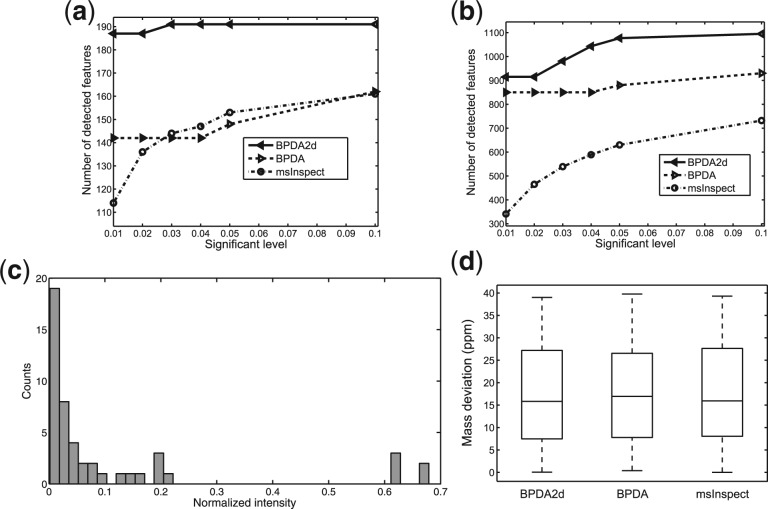
Fig. 5.
Detection results of the QTOF LC–MS/MS dataset. BPDA2d, BPDA and msInspect detected (a) total number of features and (b) number of features that can be matched to MS2 identifications at various significant levels. At significant level 0.05, the following two panels are obtained: (c) Histogram of normalized intensity of features detected by BPDA2d but not msInspect. Most of the features are from the low intensity region. (d) Box plots of absolute mass deviation of different algorithms.

