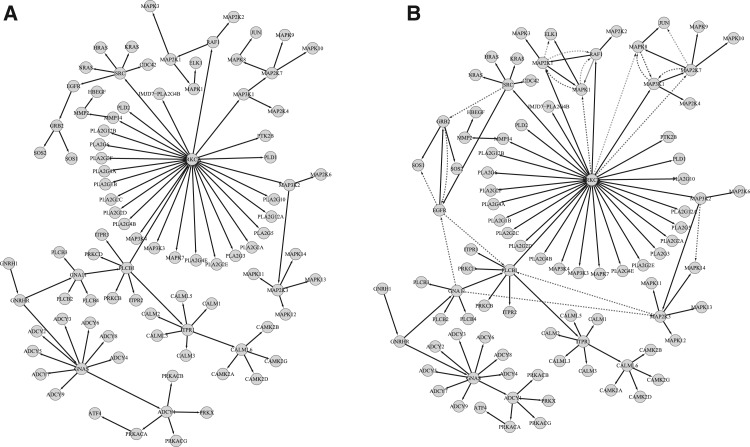
Fig. 7.
An example showcasing the performance of SA in recovering the true structure using the IFGS compendium derived from GnRH signaling pathway in KEGG database. Structures represent true (A) and inferred signaling pathways (B), respectively. The black (solid) and blue (dashed) edges represent true positives and false positives, respectively. Figures were generated using Cytoscape (Shannon et al., 2003).

