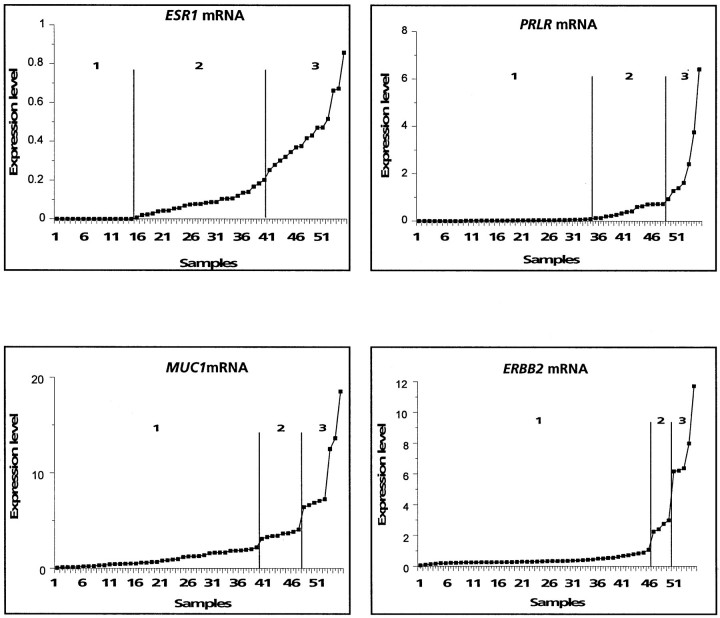
Figure 3.
Transformation of continuous cDNA array data into discontinuous data. mRNA expression levels measured by cDNA array are plotted for each sample in an increasing order. For each gene, classes are determined on visual inspection and are separated by vertical bars on the graphs. Results for ER-α (ESR1), prolactin receptor (PRLR), mucin 1 (MUC1), and ERBB2 are shown.

