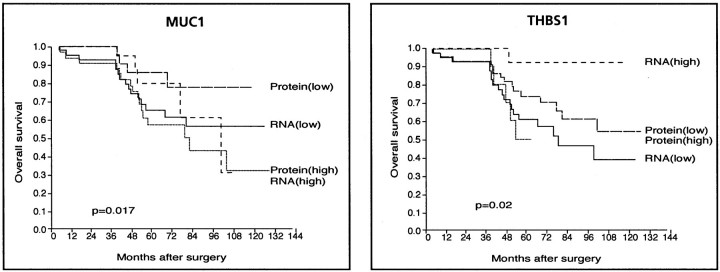
Figure 6.
Kaplan-Meier plots of patient overall survival. Left: Survival according to MUC1 mRNA and protein expression levels. Right: Survival according to THBS1 mRNA and protein expression levels (labeled high and low). High and low protein levels correspond to strong plus moderate versus weak plus negative (see Table 3▶ ), respectively, and high and low mRNA levels correspond to classes 2 and 3 versus class 1 (see Figure 4▶ ), respectively.

