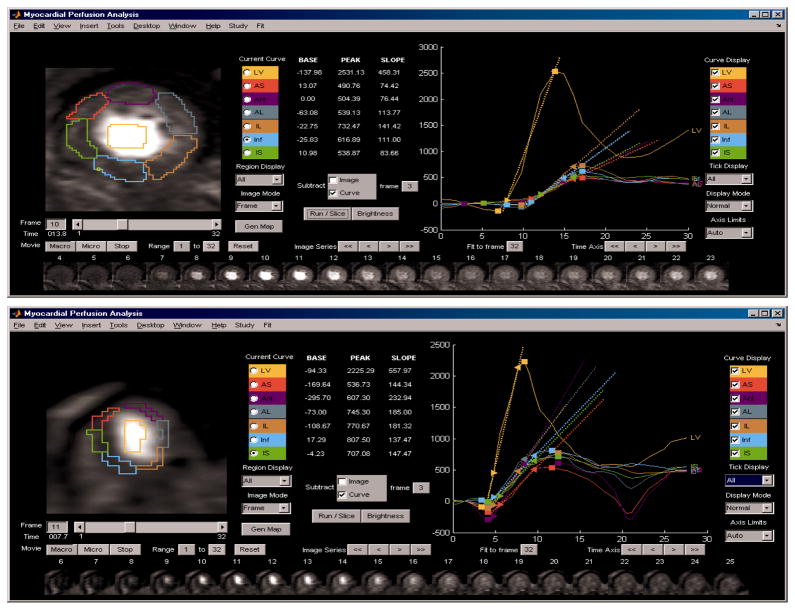
Figure 1.
Magnetic resonance (MR) myocardial perfusion image (MPI) analysis, for, top panel, a patient with a low average MPI level and, lower panel, for a patient with a high average MPI level. Six myocardial regions and a left ventricular blood pool region are drawn on one frame (lower inset). Extracted and parameterized intensity-time curves are shown in the right-hand display section for the left ventricular blood pool (highest peak) and each of six myocardial sections (closely grouped uptake curves). In these patients no perfusion defects or obstructive stenoses were present, while the patient with low MPI subsequently died and the patient with high MPI survived event free.

