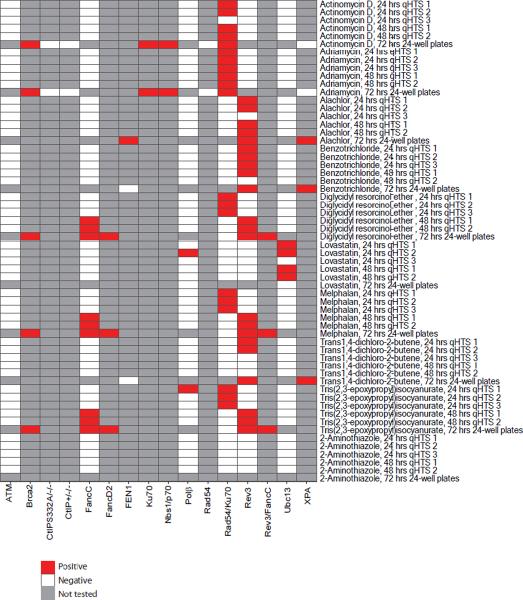
Figure 1.
Heat-map representing the presence of increased cytotoxicity in DT40 DNA repair-deficient cell lines compared to the parental DNA repair-proficient cell line at different culture times. In the follow-up study after the primary screening, all of the compounds listed in this heat-map were tested for inducing cytotoxicity after treatment for 24 hrs in three independent experiments (qHTS 1, qHTS 2, and qHTS 3), for 48 hrs in two independent experiments (qHTS 1 and qHTS 2), and for 72 hrs in one experiment (72-hr 24-well plates).
A compound that showed statistically significant differential toxicity against a mutant line is considered positive and colored red; a compound that did not show significant differential toxicity is considered negative and colored white; and compounds not tested are colored grey.

