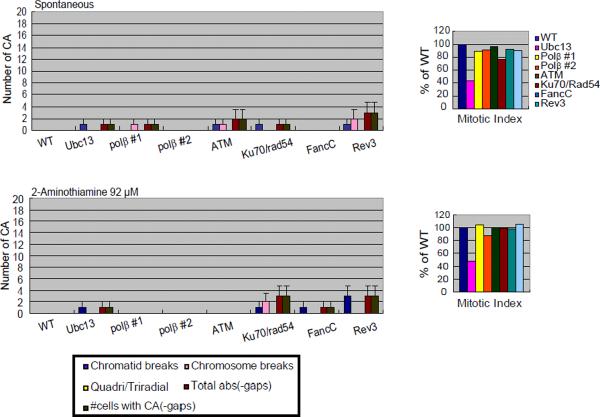
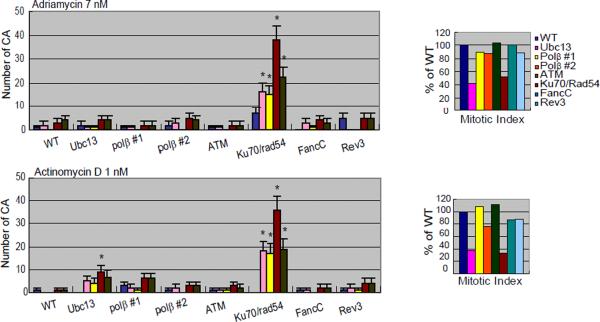
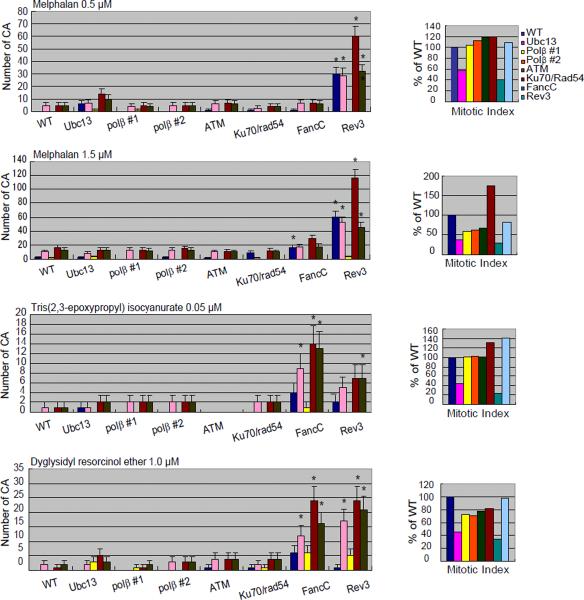
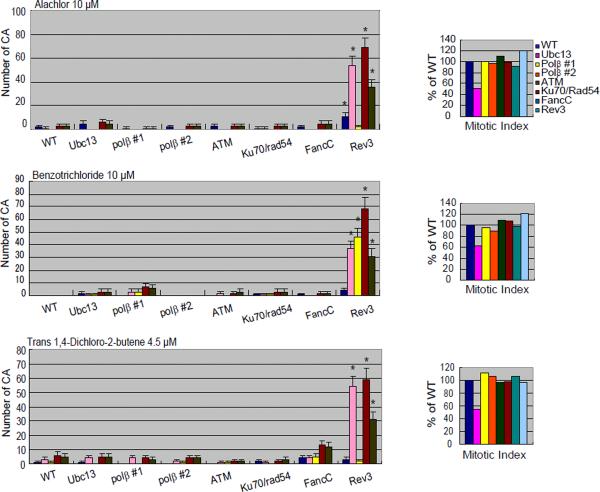
Figure 3.
Frequencies of CAs in DT40 isogenic DNA repair-deficient cell lines and the parental DNA repair-proficient cell line.
Analysis of numbers of CAs without any compounds (spontaneous; A) or after a 24-hr exposure to 2-aminothiazole (A); actinomycin D and adriamycin (B); melphalan, diglycidyl resorcinol ether, tris(2,3-epoxypropyl)isocyanurate (C); alachlor, benzotrichloride, and trans- 1,4-dichloro-2-butene (D).
The numbers of CAs are displayed on the y-axis in a linear scale. CAs were scored in 50 metaphase cells. The mitotic index (MI) in each DNA repair-deficient cell line is presented as the percentage of the MI obtained for the parental DNA repair-proficient cell line (1000 cells were scored per sample). Cells were cultured with each compound for 24 hrs, with Colcemid present for the last 3 hrs. Quadri/Triradial = the numbers of complex rearrangements; total abs (-gaps) = the total number of aberrations excluding gaps; # cells with CA (-gap) shows the number of cells that have at least one CA. Error bars show mean ± standard deviation. DNA repair-deficient cell lines with significant increase in the number of CA compared to the parental DNA repair-proficient cell line at p <0.05 (one-tailed Fisher's exact test) are indicated by an asterisk.


