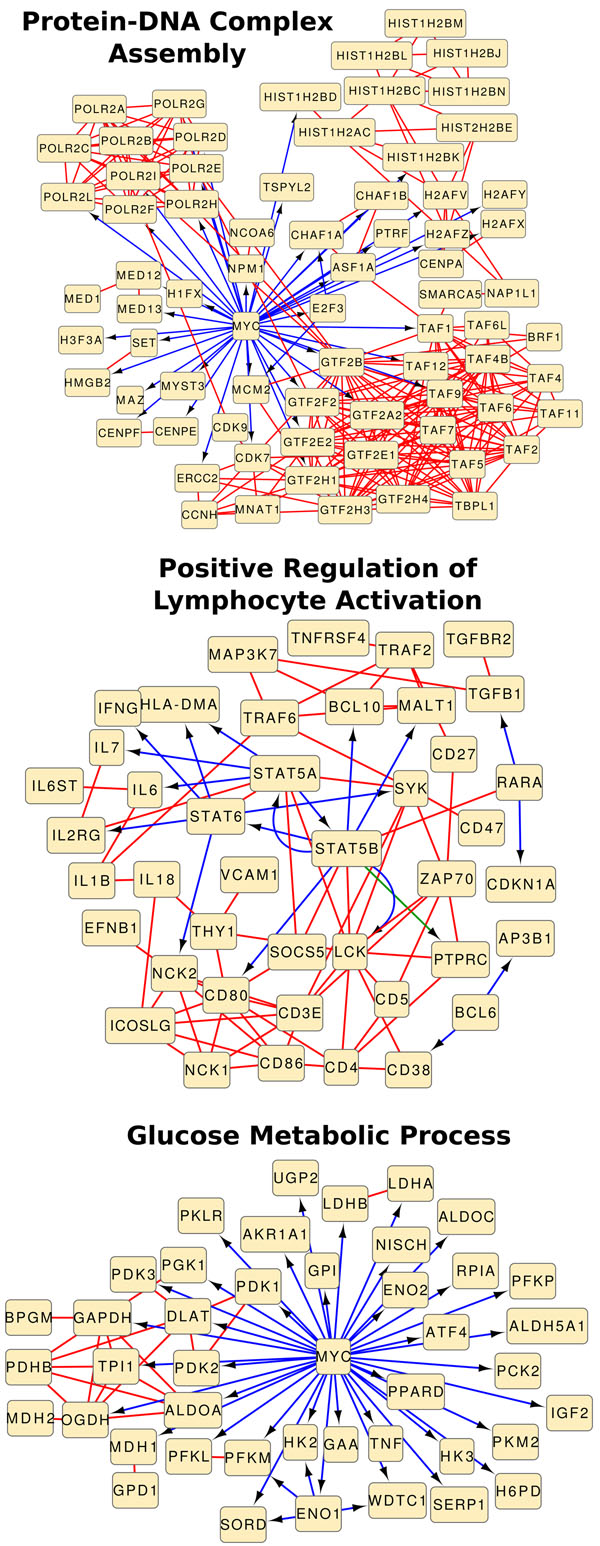
Figure 2.
Functions related to B cells. Subgraphs of the BCI induced by genes annotated with (Top) GO:0065004 Protein-DNA Complex Assembly, (Middle) GO:0051251 Positive Regulation of Lymphocyte Activation, and (Bottom) GO:0006006 Glucose Metabolic Process. The red, blue, and green edges represent protein-protein, protein-DNA, and transcription factor-modulator interactions, respectively.

