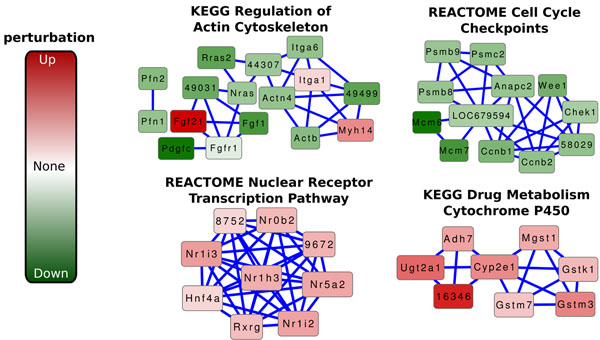
Figure 3.
Functions related to hepatic cultures.Subgraphs of a hepatocyte response network induced by genes annotated with MSigDB gene sets. (Top Left) (KEGG) Regulation of Actin Cytoskeleton, (Top Right) (REACTOME) Cell Cycle Checkpoints, (Bottom Left) (REACTOME) Nuclear Receptor Transcription Pathway, and (Bottom Right) (KEGG) Drug Metabolism Cytochrome P450. Red and green nodes indicate up- and down-regulation, respectively, of individual genes in collagen sandwich versus hepatocyte monolayer tissue cultures. Darker node color indicates higher perturbation in either direction, as indicated by the legend on the left.

