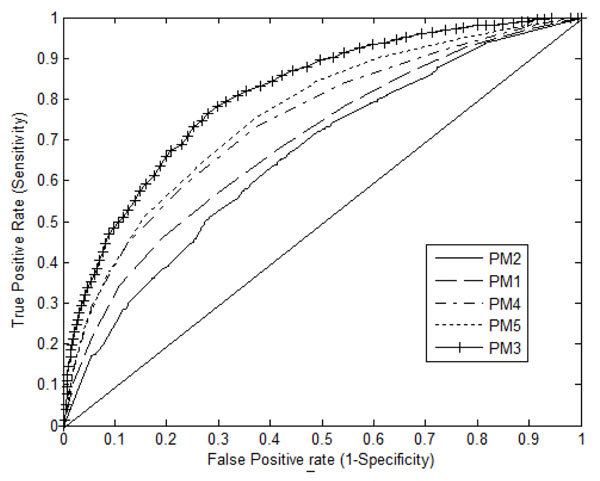
Figure 1.
ROC plot of the true positive rate versus the false positive rate of five prediction models trained with independent and integrated features. The plot consists of five ROC curves on cross validation test (i) PM1 trained with 40 features (BPC properties) (ii) PM2 trained with 5 features (atomic compositions within a residue) (iii) PM3 trained with 65 features (40 BPC with their 25 autocorrelation function values) (iv) PM4 trained with 45 features (40 BPC with 5 atomic values) and (v) 70 features (40 BPC properties, 25 autocorrelation function values and 5 atomic compositions).

