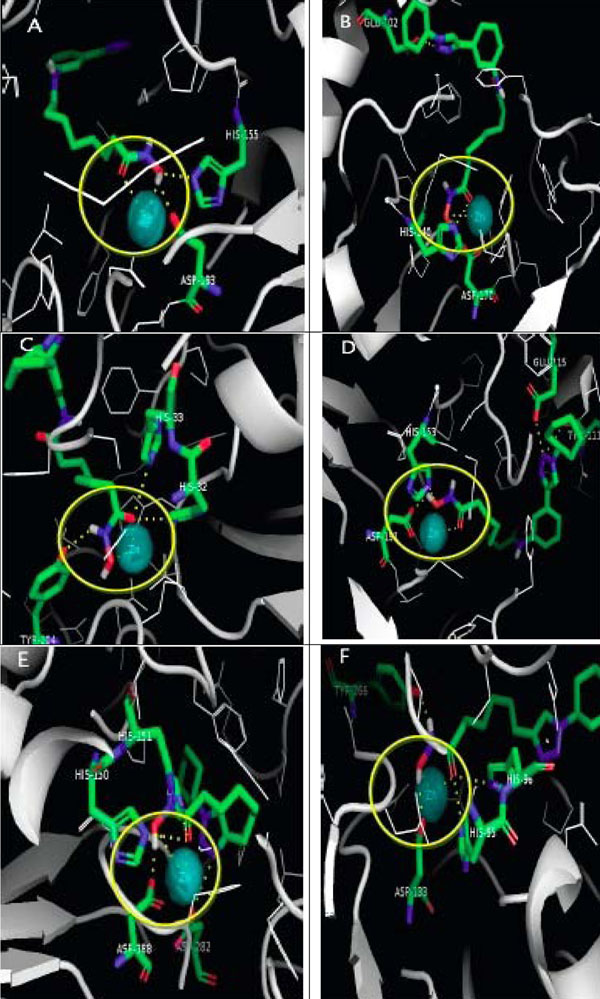
Figure 6.
3D Docking simulation results. Interaction between: A. 2c ligand and HDAC 4 Homo sapiens. B. 2a ligand and HDAC 5 Homo sapiens. C. 2c ligand and HDAC 6 Homo sapiens. D. 2c ligand and HDAC 7 Homo sapiens. E. 1c ligand and HDAC 9 Homo sapiens. F. 1c ligand and HDAC 10 Homo sapiens are shown. The area with yellow circles shows the best ligand interaction with Zn2+ ion as the enzyme catalytic site.

