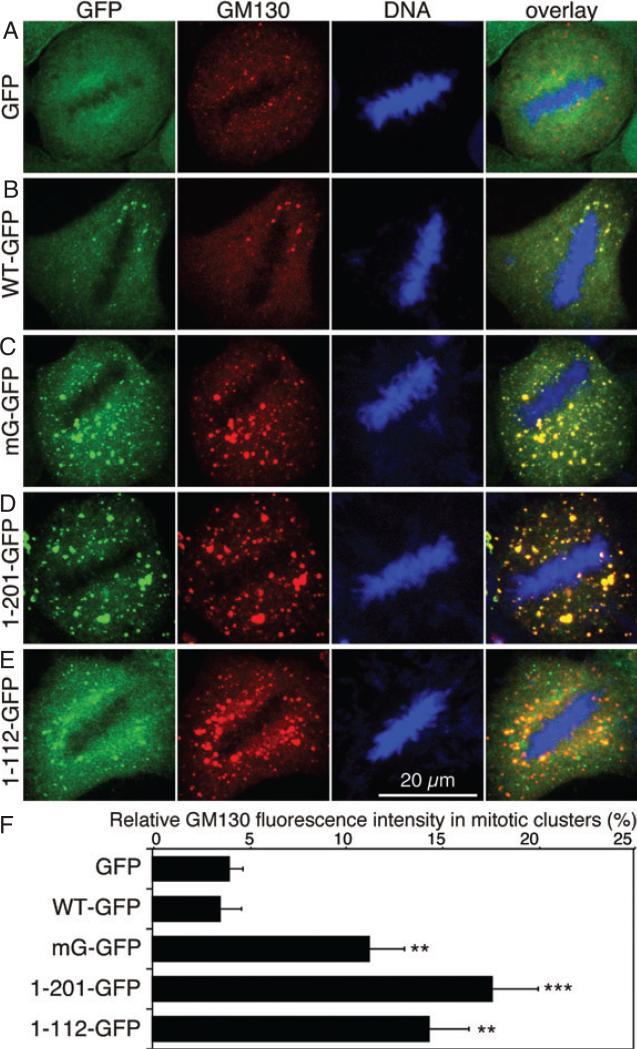
Figure 3. Expression of non-regulatable GRASP65 mutants inhibits mitotic Golgi disassembly at the light microscopy level.
A–E) Confocal images of mitotic HeLa cells stably expressing the indicated GRASP65 proteins. Cells were induced by doxycycline for 72 h and fixed, and stained for DNA and GM130. Note that the cells expressing the mG mutant (C), the GRASP domain (aa 1–201, D) and PDZ1 (aa 1–112, E) had more mitotic clusters compared with those expressing GFP (A) and wild-type GRASP65 (B). Scale bar, 20 μm. F) Relative distribution (%) of the Golgi membranes in mitotic Golgi clusters in the indicated cell lines. The fluorescence intensity of GM130 was quantified using the ImageJ software for the total fluorescent intensity and a threshold was used to filter the fluorescence in Golgi haze to quantify the fluorescent intensity in mitotic Golgi clusters. The average percentage of fluorescent intensity in Golgi clusters (mean ± SEM) from 10 cells in each cell line is shown. Statistical significance was assessed by comparison to the GFP cell line. **p < 0.005; ***p < 0.001.

