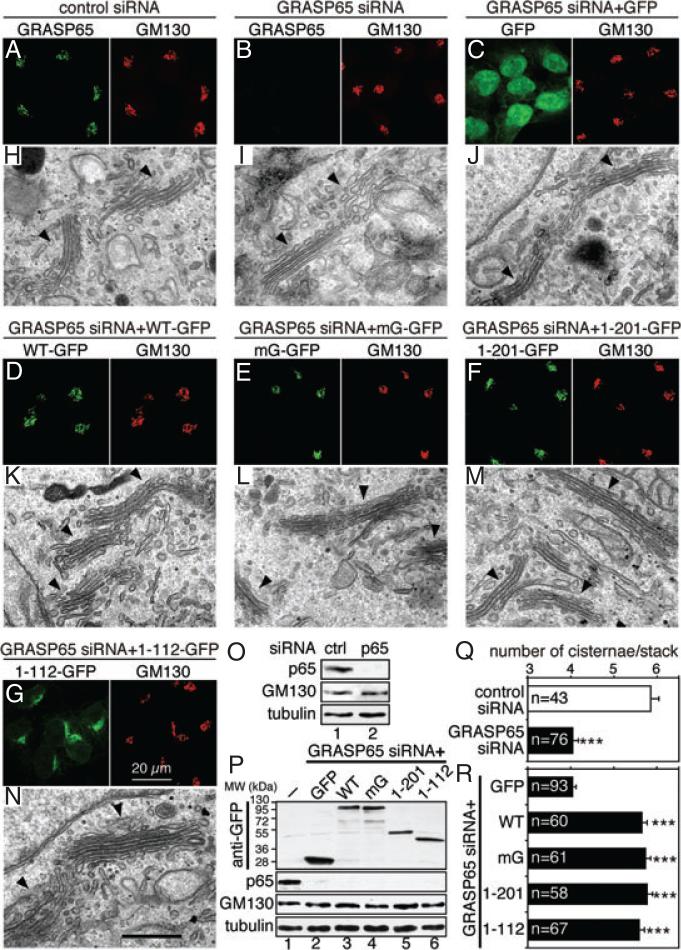
Figure 5. Depletion of GRASP65 reduces the number of cisternae per stack, which can be rescued by the expression of exogenous GRASP65.
A and B) Confocal fluorescence images of GRASP65 knockdown cells. HeLa cells transfected with indicated siRNA oligos were fixed and immunostained for GRASP65 and GM130. C–G) Confocal fluorescence images of HeLa cells in which endogenous GRASP65 was replaced by exogenous GRASP65 or its mutants. HeLa cells expressing indicated proteins were transfected with siRNA oligos for human GRASP65. Doxycycline was added 24 h after transfection. Cells were fixed 96 h after transfection and immunostained for GM130. H–N) Representative EM micrographs of cells described in (A–G). Arrowheads indicate Golgi stacks. Note that the number of cisternae per stack was reduced in GRASP65-depleted cells (I), which was restored by the expression of rat GRASP65 or its mutants (K–N), but not by GFP (J). O) Immunoblots of HeLa cells described in (A) and (B). The knockdown efficiency of GRASP65 was 94.1 ± 2.9%. P) Immunoblots of HeLa cells described in (C–G), in which endogenous GRASP65 was replaced by rat GRASP65 or its mutant. Lane 1, control cells with neither GRASP65 depleted nor exogenous protein expressed; lanes 2–6, cells with GRASP65 knocked down and indicated exogenous protein expressed. The knockdown efficiency for GRASP65 was 95.4 ± 0.6% for the GFP cell line and was similar in other cell lines, while GM130 expression level was not significantly affected. Q) Quantitation of the EM images in (H and I) in one representative experiment from three sets of independent experiments. Only stacks with three or more cisternae were counted. The number of Golgi stacks quantified was indicated. Results expressed as the mean ± SEM. Note that GRASP65 depletion reduced the average number of cisternae per stack. ***p < 0.001. R) Quantitation of the EM images in (J–N). Note the increase in cisternal number per stack by expression of GRASP65 and its mutants in GRASP65 knockdown cells. Statistical significance was assessed by comparison to the GFP cell line. ***p < 0.001. Bar charts indicating the actual frequency of each value of Golgi cisternae are shown in Figure S2.

