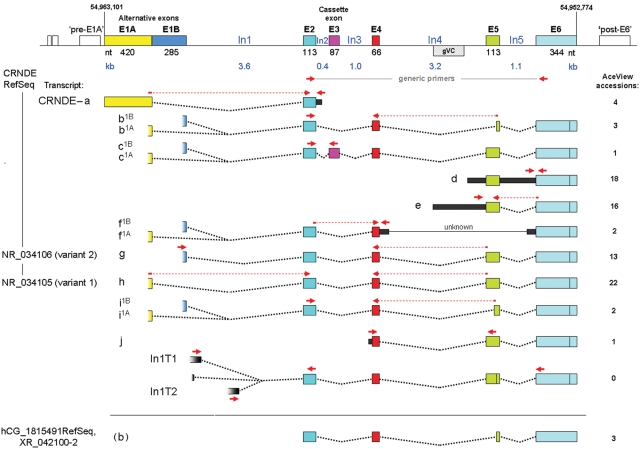
Figure 1.
Genomic locus for CRNDE. Exons (wide bars with colored fill) are shown approximately to scale; introns (black lines) are shown likewise but on a much smaller scale. Nucleotide numbering is for GRCh37/hg19. The region of greatest sequence conservation, here called gVC for “genomic Vertebrate Conserved” (stippled box), and transcribed extensions to exons (narrow bars with black fill) are depicted using the intron scale. The alternative exons E1A and E1B overlap by 9 nt. The hypothetical exons upstream of E1A and downstream of E6 correspond to speculative probe sets in the Affymetrix exon arrays. Numerical exon boundaries are provided in Supplementary Table S3. Transcript identification letters are based on those for hCG_1815491 in the Apr07 release of AceView, augmented by our own findings (e.g., In1T transcripts). While our nomenclature system would naturally identify transcript CRNDE-g and -h as CRNDE-g1B and -g1A, respectively, we have retained the former designations to maintain parity with AceView. Wherever the presence of a partial exon sequence in an AceView isoform is considered merely to reflect incomplete recovery of the actual sequence, the complete exon is shown. While the 2 major 3′ boundary options for E6 are indicated, others are known but not shown (Suppl. Table S3). The current NCBI Reference Sequence (RefSeq) isoforms for CRNDE are identified on the left, while the original RefSeq for hCG_1815491 is shown at the bottom. Primer pairs (red arrows) are as listed in Supplementary Table S1B; any primer that spans an exon splice junction is shown as a bipartite arrow with a dotted line spanning the absent intronic sequence.

