Figure 2.
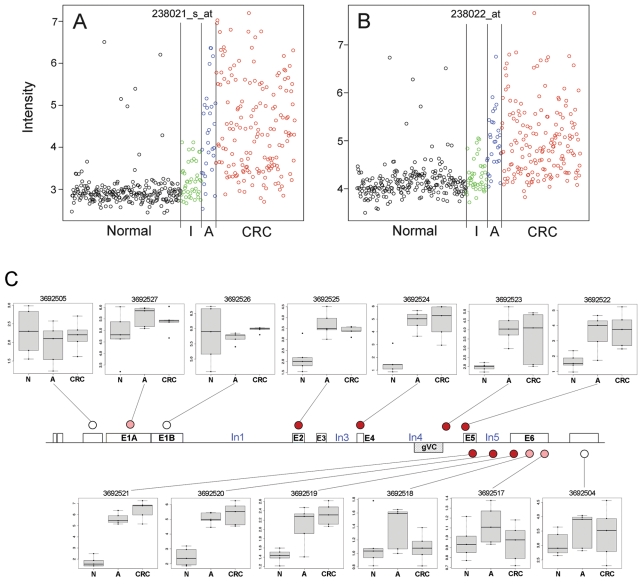
Affymetrix expression microarray data for colorectal tissue. (A, B) Discovery data for CRNDE probe sets 238021_s_at and 238022_at, respectively, in Affymetrix HG U133 A/B arrays. Both are scatter plots of RMA-normalized fluorescence intensity values, expressed against an arbitrary index to provide a horizontal offset for each array. Sample categories are normal tissue (N) (n = 222), inflammatory bowel disease (I) (colitis) (n = 42), adenoma (A) (n = 29), and colorectal cancer (CRC) (n = 161). (C) Box and whisker plots of RMA-normalized fluorescence intensity for CRNDE probe sets in exon microarrays hybridized with cDNA from colorectal tissue. Sample categories are normal tissue (N) (n = 5), adenoma (A) (n = 5), and colorectal cancer (CRC) (n = 5). For each probe set, the change in expression signal for neoplastic relative to normal tissue is reflected qualitatively by the shading of the disc at the probe set location, as follows: little or no change in white, modest increase in gray (pink in online color art), and large increase in black (red in online color art). Larger versions of the probe set box plots are presented in Supplementary Figure S1C.

