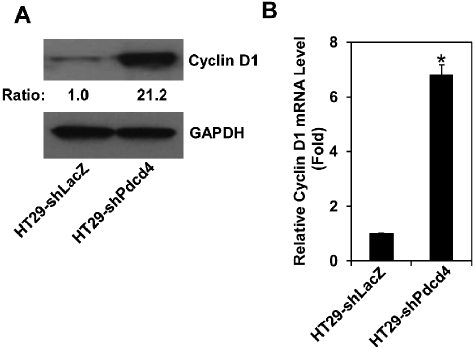
Figure 2.
Knockdown of Pdcd4 up-regulates cyclin D1 expression. (A) The protein level of cyclin D1 in HT29-shLacZ and HT29-shPdcd4 cells was examined using Western blotting analysis. The ratio of cyclin D1/GAPDH in HT29-shLacZ cells is designated as 1.0. (B) The cyclin D1 mRNA levels in HT29-shLacZ and HT29-shPdcd4 cells were analyzed with real-time PCR. Three independent experiments were performed with triplicates for each sample every time. Results are expressed as mean ± standard deviation (n = 3). The ratio of cyclin D1/GAPDH in HT29-shLacZ cells is designated as 1. The asterisk indicates a significant difference by 1-way ANOVA (P < 0.001).

