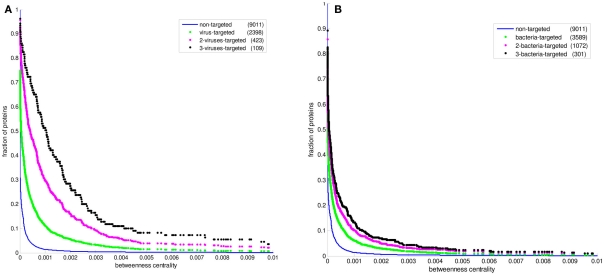
Figure 3.
The cumulative betweenness centrality distributions of human protein sets. The distribution of all proteins in the PPI network is given in comparison with (A) the bacteria-targeted sets, and (B) the virus-targeted sets. The number of proteins in each set is given in the parentheses. The fraction of proteins at a particular value of betweenness centrality is the number of proteins having that value and greater divided by the number of proteins in the set.

