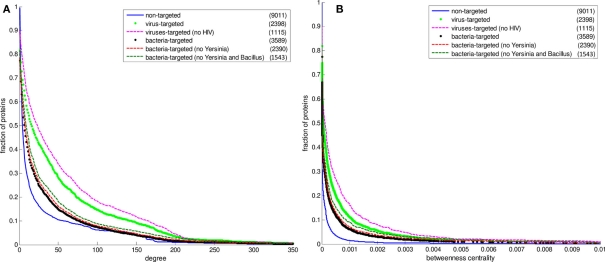
Figure 4.
The cumulative distributions of degree and betweenness centrality of human proteins excluding Yersinia and HIV data. The number of proteins in each set is given in the parentheses. (A) The degree distributions (B) the betweenness centrality distributions. The fraction of proteins at a particular value of degree is the number of proteins having that value and greater divided by the number of proteins in the set.

