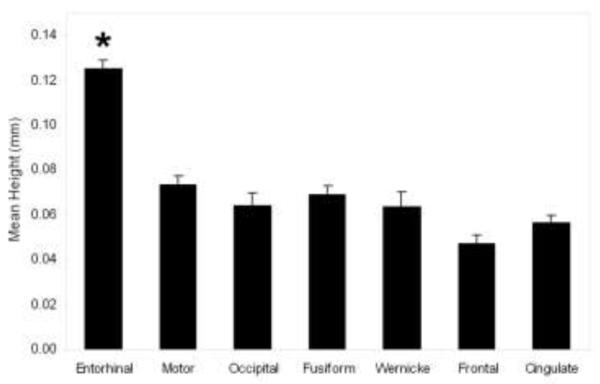
Fig. 4.
Mean entorhinal verrucae height measures from six control cases (0.13 mm) were significantly higher than mean height of other cortices (motor cortex (p<0.001), occipital (p<0.001), fusiform (p<0.001), Wernicke’s (p<0.001), frontal (p<0.001) and cingulate (p<0.001)). These cortical regions were measured as a control surface and all heights measured less than 0.10 mm. Asterisk (*) represents significant difference between entorhinal and other cortices. Error bars represent standard error.

