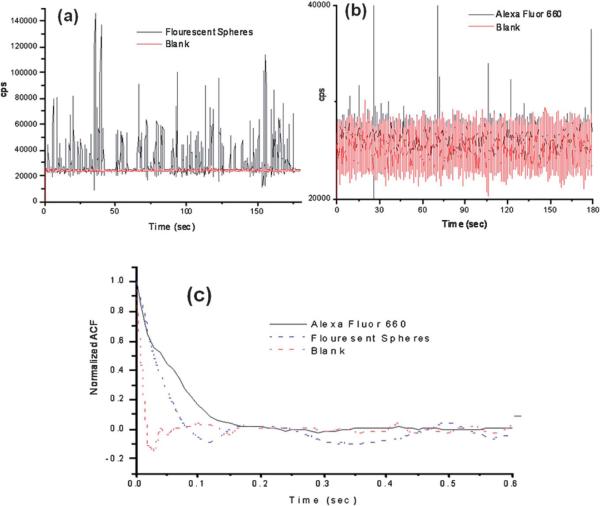
Fig. 4.
Photon burst data collected using the compact, field-deployable SMD instrument. The red trace shows the blank and the black trace is the data with fluorescent beads or dye seeded into the buffer. (a) Plot of photon bursts generated from fluorescent microspheres. (b) Single AlexaFluor 660 dye molecule burst data. (c) Autocorrelation analysis was performed on the blank, fluorescent spheres and AlexaFluor 660 dye molecule solutions. The fluorescent microspheres and the AlexaFluor dye molecules showed transit times of 49 ms and 53 ms, respectively, using the same flow rate.

