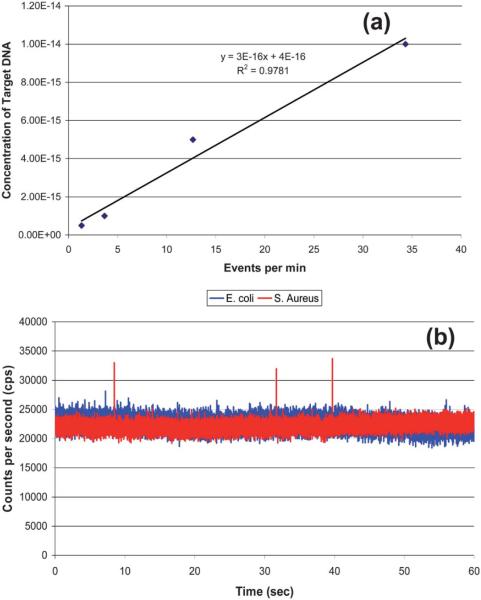
Fig. 7.
(a) Calibration curve generated from the data shown in Fig. 6. The data points were fit to a linear function, y = 3 × 10¹⁵ x − 0.9291, with R2 = 0.97. (b) rDNAextracted from 2,000 S. aureus cells (Gram (+)) and mixed with the 0.5 nM MB solution. As a control, DNA from E. coli (Gram(−)) was extracted and mixed with the MB solution as well. The S. aureus showed 3 events above the discrimination level whereas the E. coli showed no events above this level.

