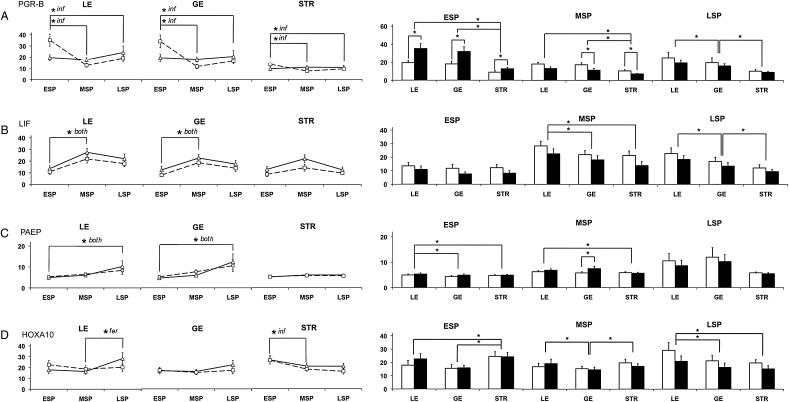
Figure 3.
Quantitative IHC of PGR-B, LIF, PAEP and HOXA10 in endometrial biopsies of women from fertile and infertile couples. The mean gray levels (arbitrary units; y-axis) were determined for PGR-B (A; fertile, n = 89; infertile, n = 86), LIF (B; fertile, n = 87; infertile, n = 86), PAEP (C; fertile, n = 89; infertile, n = 89) and HOXA10 (D; fertile, n = 86; infertile, n = 87) in each tissue type, as described in the section Materials and Methods, showing temporal changes in each cell type (lines), and cell-type differences (bars) during the ESP (n = 57), MSP (n = 80) and LSP (n = 41). Fertile controls are represented by a solid line (triangles) or open bar, and samples from women of infertile couples by a dashed line (squares) or solid bar. *P < 0.05 for temporal changes (lines) according to Student–Newman–Keuls post hoc comparisons, with indication of changes specific to the fertile controls (fer), infertile couples (inf) or both (both) groups; cell-type-specific differences (bars), or differences with fertility status (bars) according to Student's t-test. Error bars indicate the SD.

