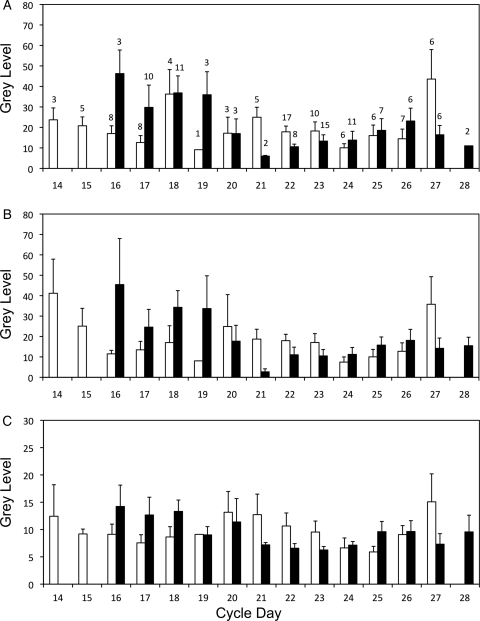
Figure 4.
Analysis of PGR-B levels in endometrial biopsies of women from fertile and infertile couples at different stages of the cycle. Mean gray levels were grouped according to histological dating. Tissue type-specific data are shown for LE (A), GE (B) and STR (C), and for fertile controls (open bars) and women of infertile couples (solid bars). The number of patients in each group is indicated above each bar in the first panel. The decrease in expression seen in fertile controls during the early secretory phase appears to be delayed in women of infertile couples. Error bars indicate the SD.

