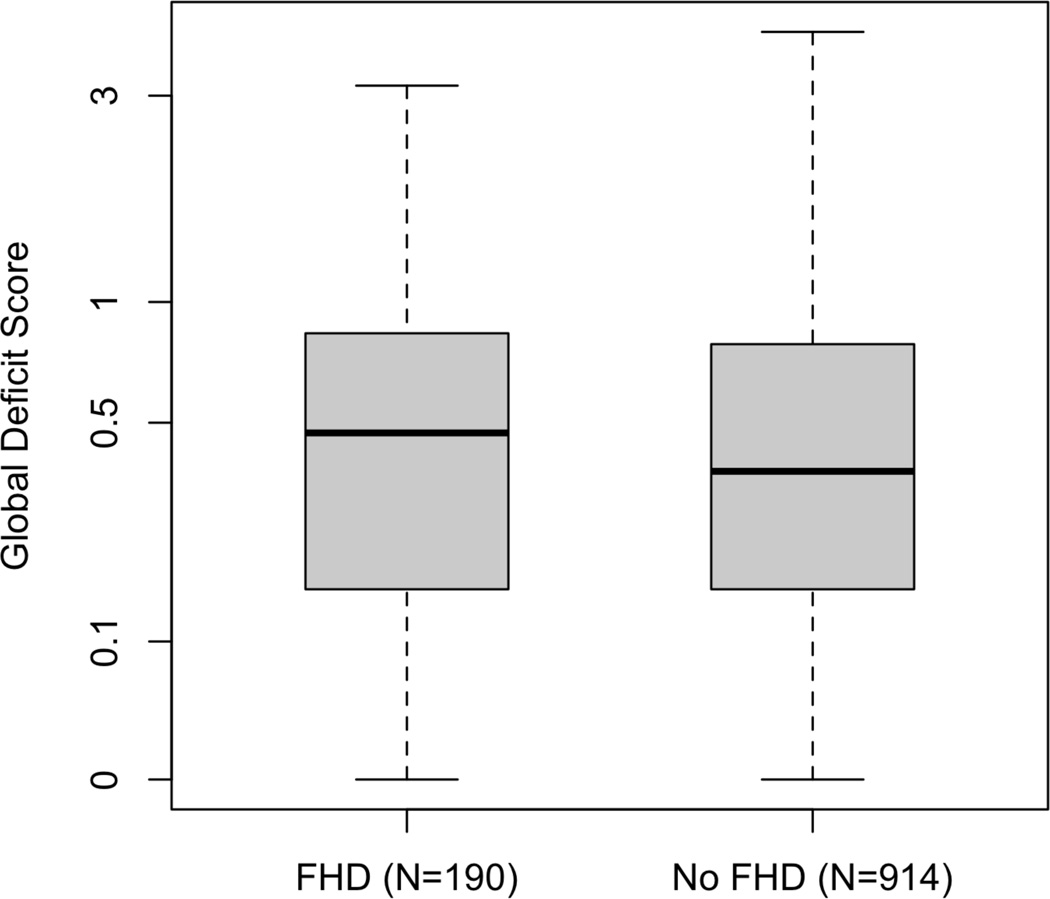
Figure 1.
HIV+ persons with a FHD have worse NP functioning that those without FHD, p=0.041. The horizontal bars represent median GDS values, the boxes contain the middle 50% of the observations, and the whiskers extend to the minimum and maximum GDS values. The GDS is plotted on a logarithmic scale.

